Quantitative Analysis
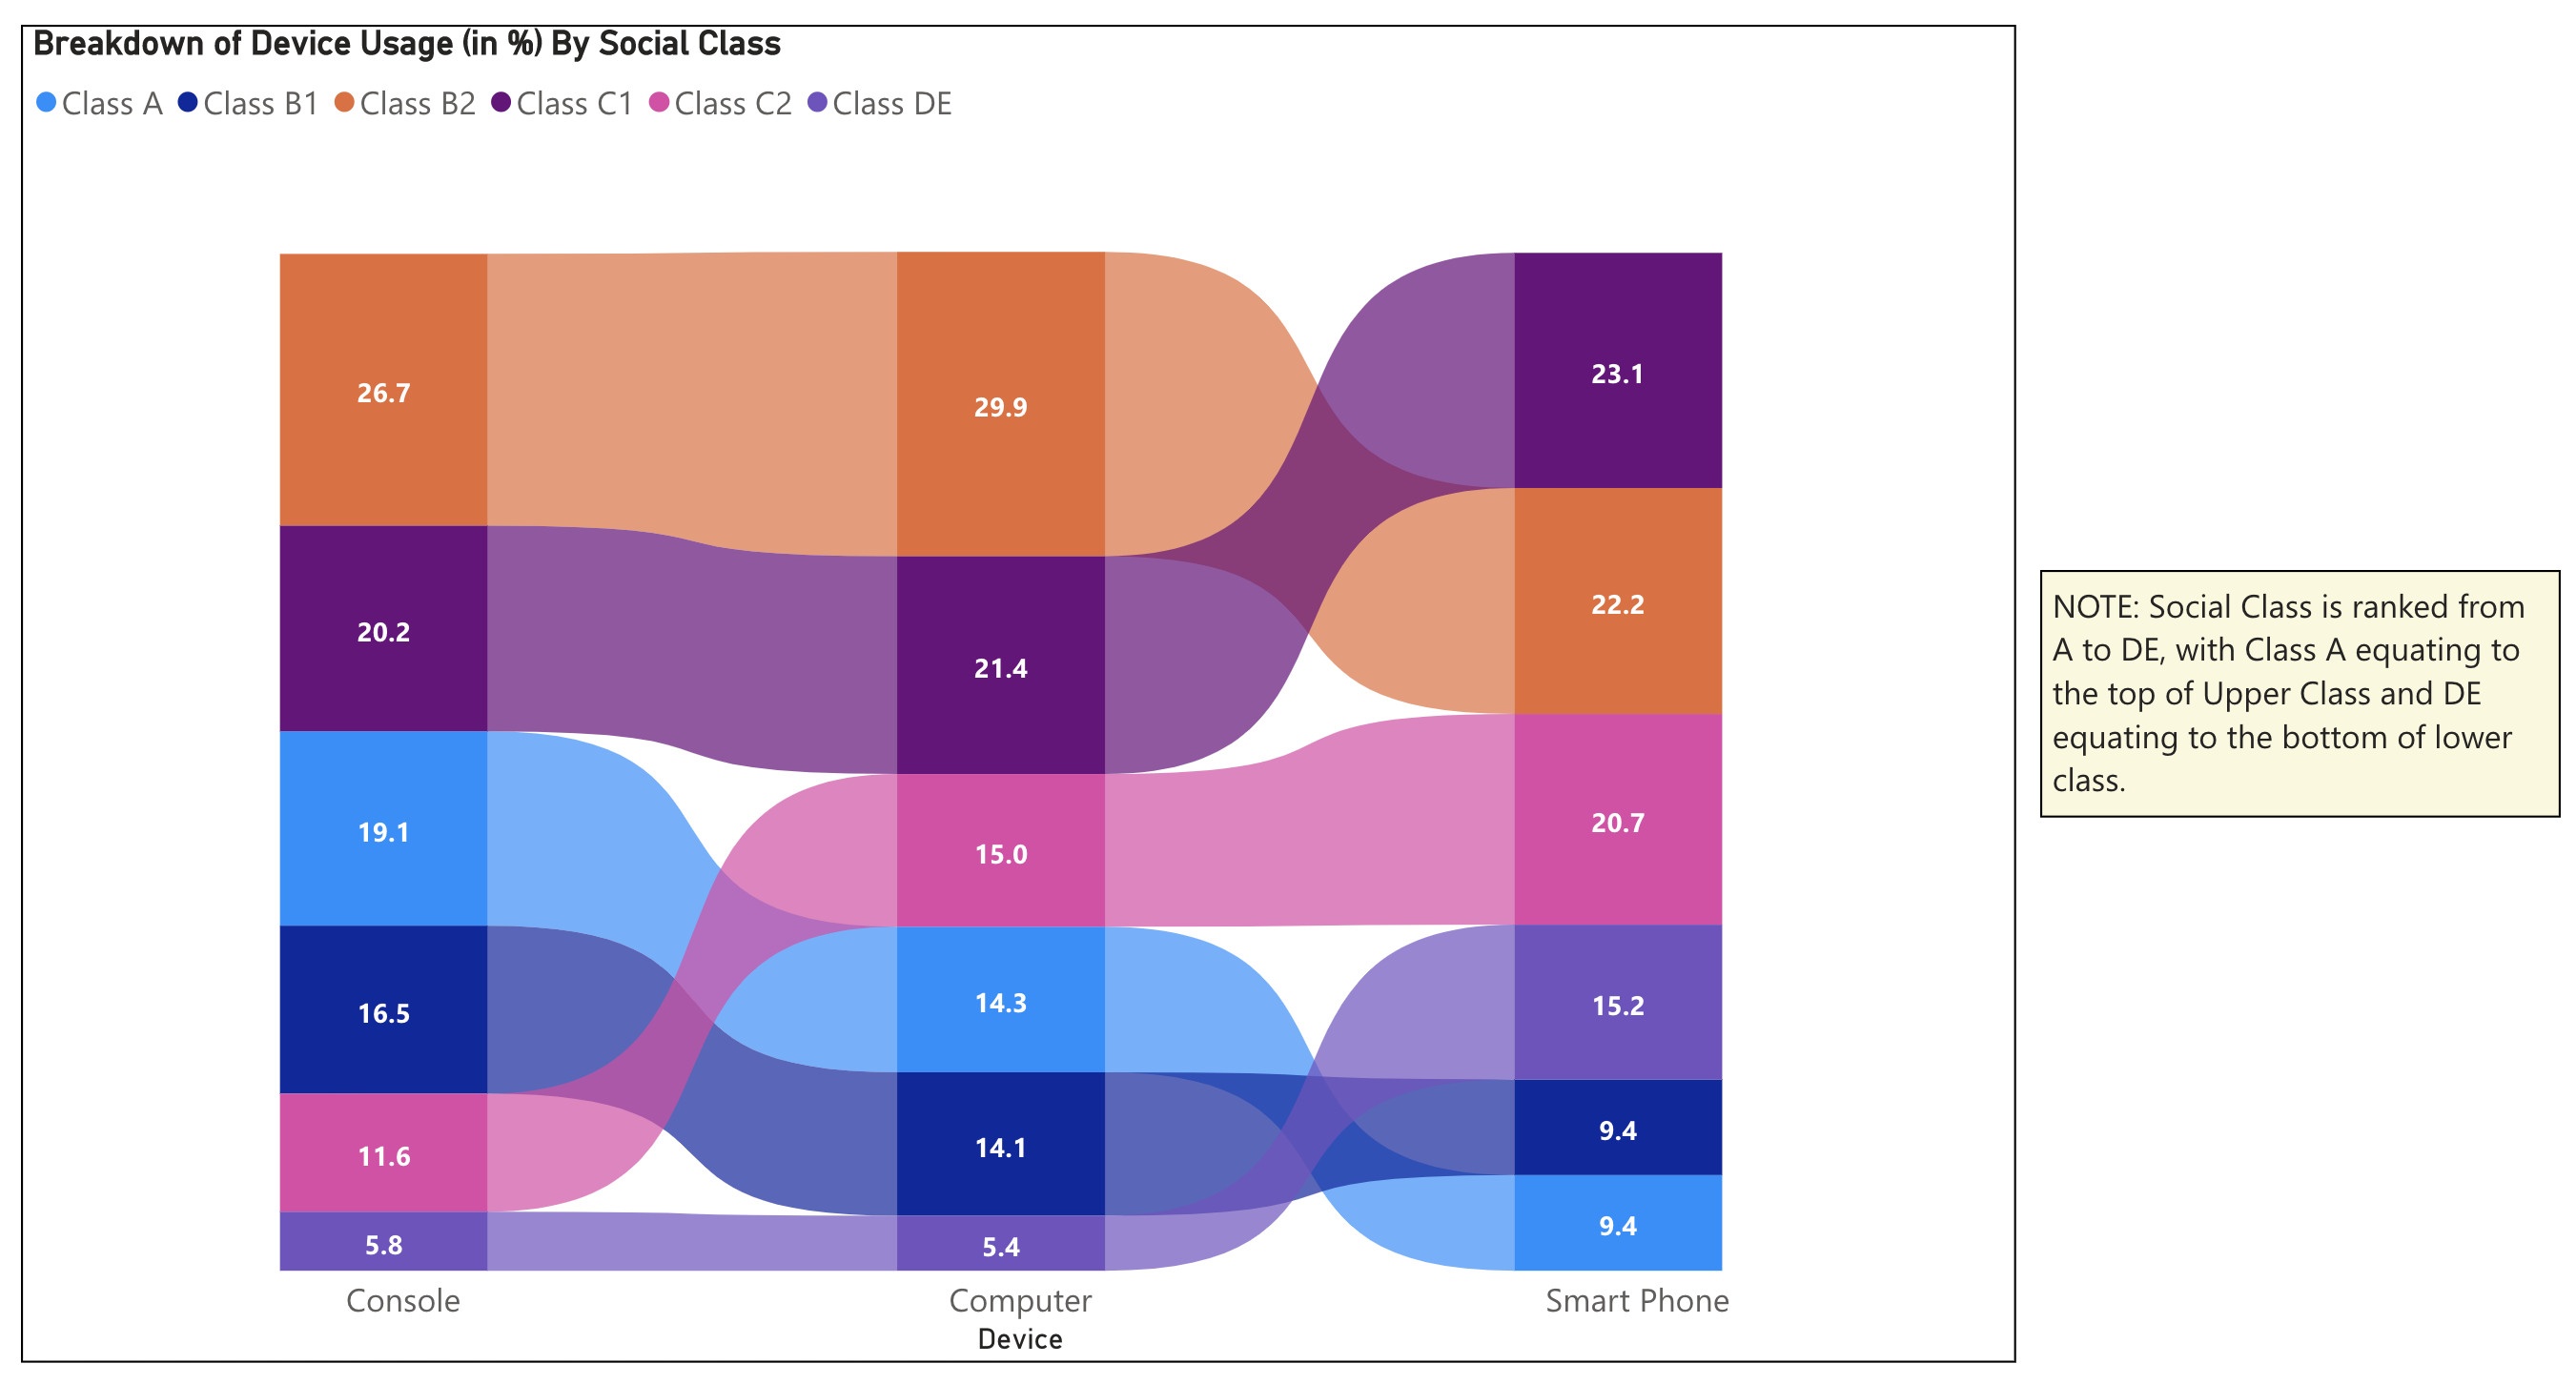
The chart below depicts as a ribbon chart the breakdown of Brazil’s gaming population by social class and the frequency spread of what devices are used per class. Social class is an important metric to analyze because there is a strong correlation between social class and spending power. By seeing the full spread of data, it is possible to determine the best possible ROI based on the amount of gamers in a given social class and what devices they prefer to game on.

References
(2022). PGB22 – Pesquisa Game Brasil – 9ª Edição Gratuita – 2022. PGB. https://www.pesquisagamebrasil.com.br/en/


